Maximize Your Investment in Sustainability Reports
As our conversations have kicked off with clients regarding improvements for their annual and sustainability reports, common needs have emerged:
“Ensure readers see and engage with key messages and content.”
“Create infographics to visually enhance the story.”
“Use design to increase the overall legibility of the report.”
One of the best ways to achieve all three is to think about ways to visually tell critical parts of your company and/or brand story – typically through data design or illustrated infographics. Sustainability reports and ESG content are filled with stories, content and data about your organization’s efforts and successes – but the reality is that we can no longer expect the reader to actually read your story cover to cover. The best way to ensure your points come across is through visualization.
The investment in information design and infographics is just that – an investment. Anyone who has worked on a report recognizes how much time, effort and budget goes into developing and approving rich content. To let that content die between the pages of your report is wasteful and in some ways contradictory to sustainability principles. You’ve spent time and money creating it, legal has approved it – why not use it? We consider these visualizations valuable brand assets that should be repurposed in multiple ways and in multiple places for multiple stakeholders.
ESG is important to all of your stakeholders and a part of your overall brand story. Therefore, the extended use or repurposing of this content will enhance your communications effort with key constituents. In addition, giving your content a longer shelf life helps reinforce your message and further showcases ESG as instrumental to who you are and how you operate. From sales and marketing, to recruiting, to community relations efforts, there are limitless opportunities to utilize these creative assets beyond the report. Last, and certainly not least, providing your employees with this content will help them understand these efforts are part of your organizational DNA, not just part of your marketing.
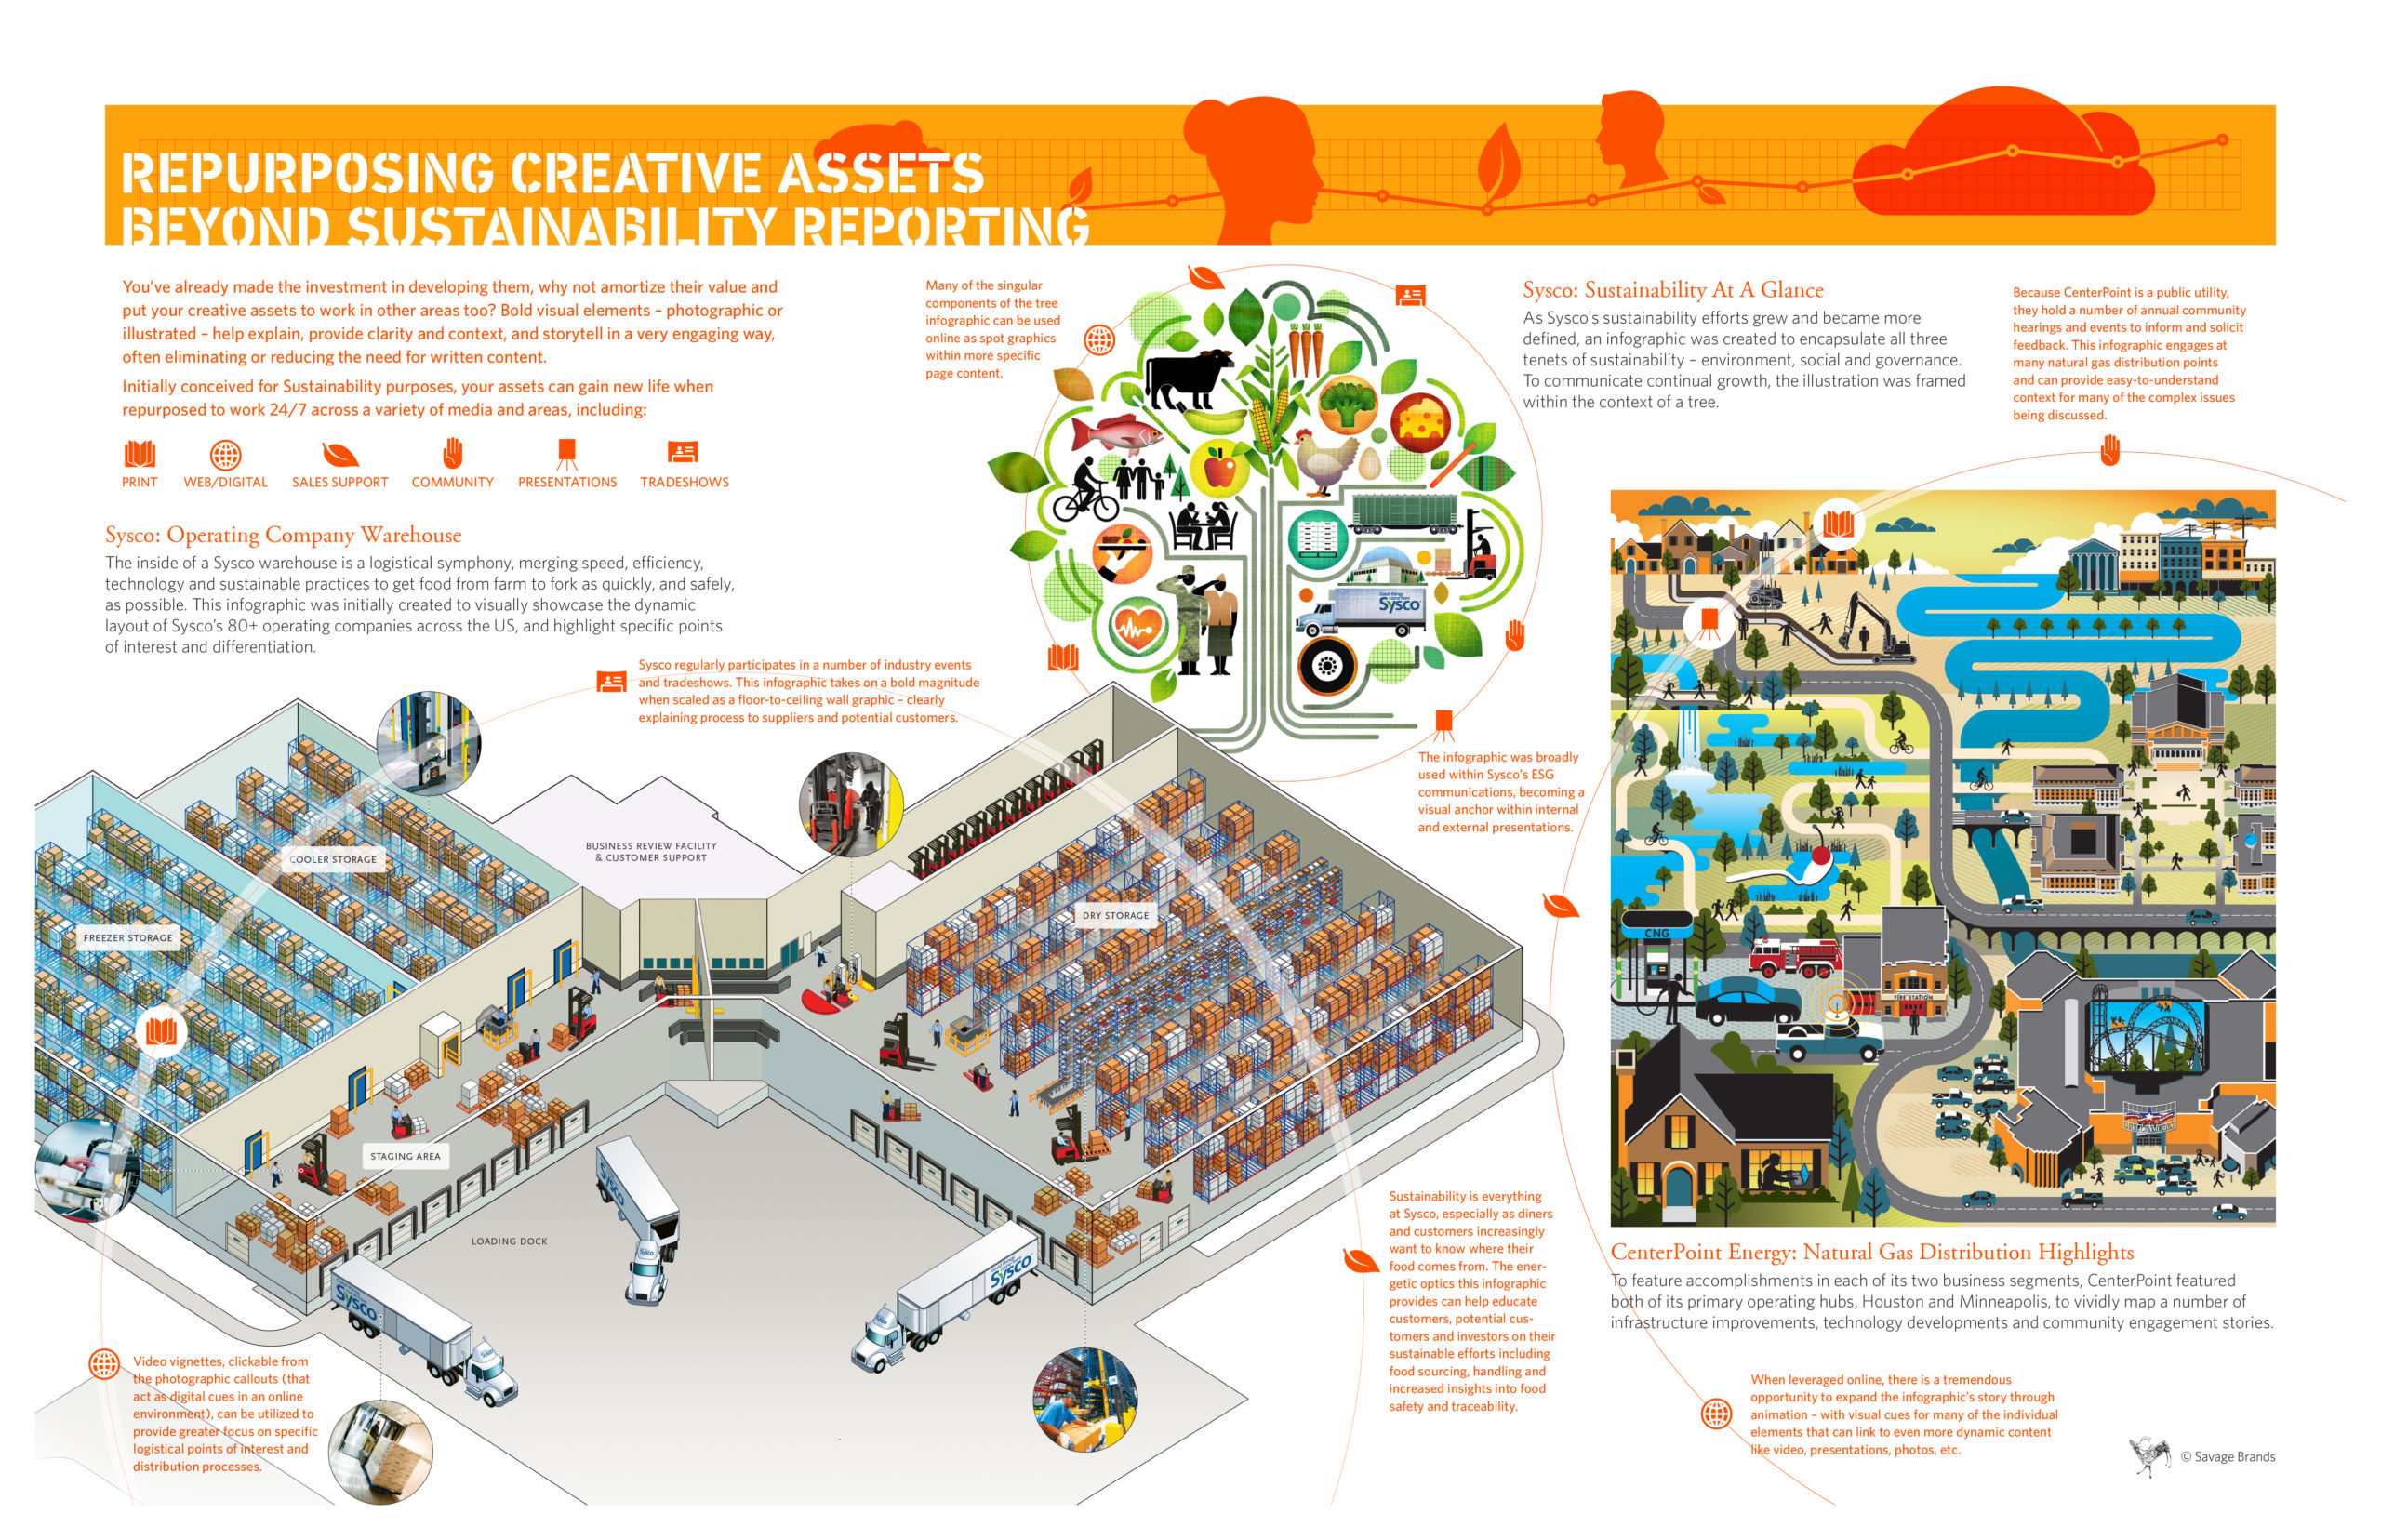
Below you can see a few examples of how visual infographics can be maximized and used for multiple purpose. Hopefully it provides inspiration for how to leverage content you create for your ESG story.
![]() As President at Savage Brands, Bethany is known for forging powerful connections – connecting people to people and connecting companies with the fresh ideas that make their brands purposeful. In her recent book, "Get Your Head Out of Your Bottom Line and Build Your Brand on Purpose," Bethany conveys to business leaders the importance of leading with purpose.
As President at Savage Brands, Bethany is known for forging powerful connections – connecting people to people and connecting companies with the fresh ideas that make their brands purposeful. In her recent book, "Get Your Head Out of Your Bottom Line and Build Your Brand on Purpose," Bethany conveys to business leaders the importance of leading with purpose.
